
DOSY experiments
Diffusion Ordered SpectroscopY, or DOSY, is a technique for separating NMR signals by their diffusion coefficients. A typical 2D DOSY spectrum has a 1H dimension that corresponds to the 1D 1H spectrum and a diffusion dimension in which molecules with different diffusion coefficients are separated. The diffusion coefficient is the rate at which a molecule translates through the solution, and so is related to the size of the molecule.
Methods for setting up and processing DOSY spectra on our spectrometers are provided with TopSpin. The manual for running DOSY experiments in TopSpin can be found here.
Background
There are several different DOSY pulse sequences available but all do essentially the same thing;
- xy magnetisation is created,
- a gradient pulse of variable strength is applied,
- the sample is allowed to diffuse during a fixed delay,
- a second refocusing gradient pulse is applied,
- and finally the signal is recorded.
If we allow the molecules in the sample to diffuse during a fixed delay between a pair of gradients they may move from their original position in the sample tube so that the magnetic field created by the second gradient may not exactly match the first. In this case their magnetisation will not be exactly refocused, leading to a decrease in signal intensity. By recording a series of spectra with different gradient strengths the signal intensity can be plotted against the gradient strength to get a sigmoidal curve that can be fitted to an equation.
Setup
Suppress solvent peaks
The DOSY data analysis that extracts the diffusion rates does not cope well with peaks that vary a lot in intensity. If you have large solvent peaks in your 1H spectrum you should try to suppress them so that they are no more than 5-10 times the size of your sample peaks. For water, presaturation is normally the best suppression technique. If that does not give good results try excitation sculpting. See the solvent suppression notes.
Load parameters
Once you have obtained a good 1H spectrum you can create a DOSY experiment using one of the standard parameter sets, e.g. UCSD_DOSY or UCSD_DOSY_PRESAT.
Optimise parameters
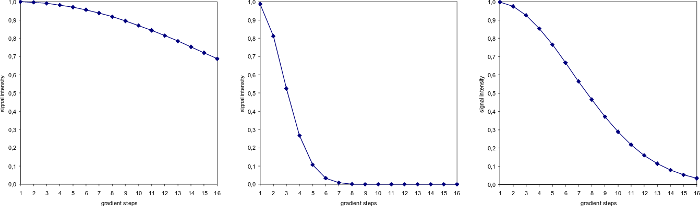
To get the best results the gradient duration and diffusion delay should be optimised to sample the signal decay fully. The graphs below plot signal intensity against gradient strength. In the left graph the range of gradient strengths used was too small to sample the decay properly. In the middle graph the range of gradient strengths was too large. In the third graph the range of gradients used enabled optimal sampling of the decay.
To check how well the signal decay is being sampled run a DOSY experiment with just three different gradient strengths and compare the signal intensity of the three rows.
- on the TopSpin command line enter "dosy"
- in the pop-up window accept all the default parameters, except for number of gradients. For this option enter "3"
- when the experiment is finished fourier transform the data using "xf2" and phase it
- extract the three transformed rows and store them in new process numbers using "rsr"
- overlay the three extracted rows for direct comparison by clicking the multiple display icon

The first row should have the maximum intensity, the intensity of the second row should be about half of the first, and the third row should have near zero intensity.
If the intensity of the third row is not near zero then you are in the situation shown above in the left graph. The gradient duration (p30) or the diffusion delay (d20) or both needs to be increased. The default gradient duration is 1500us. It can be increased up to 2500us. If increasing the gradient duration does not give you good sampling, then you can try increasing the diffusion delay. The default diffusion delay is 50ms, and it can be increased to 100ms.
If the intensity of the second and third rows are both near zero then you are in the situation illustrated by the middle graph. The gradient duration (p30) and diffusion delay (d20) should be reduced. Check that the diffusion delay is set to the default, minimum value of 50ms, and then try reducing the gradient duration. You should not need to set it much lower than 500us.
Acquisition
DOSY experiments need to be started using the macro "dosy". If you start the experiment with the usual "zg" command you will get a series of 1Ds all run with the same gradient strengths and thus no signal decay. The "dosy" macro asks a series of questions so that it can calculate a list of gradient strengths. All the questions have sensible, default values which should give you a good spectrum.
To run the experiment
- on the TopSpin command line enter "dosy"
- in the pop-up window answer the questions (defaults are all reasonable)
Note that the dosy macro will adjust the value of TD in F1 to match whatever
value you enter for the number of gradient strengths. This means you
don't have to set TD in F1.
Processing
To process the DOSY spectrum you need to use the "eddosy" macro. This will display the DOSY processing parameters which are different from the standard ones. Mostly you can use standard options and click icons.
- on the command line type "eddosy"
- in the pop-up window select "Standard Dosy parameters"
- click the set diffusion parameters icon

- click the display limits icon

- click the fourier transform icon

- phase correct the first row
- click the fitting icon

The DOSY spectrum typically has more data points than a normal 2D spectrum so may take longer to process and display.
The one DOSY processing parameter that you may want to change is "Scale". The default value is "Logarithmic" but the alternative, "Linear", may give a better visualisation of the data.
Written by Brendan Duggan. Last modified 2022-Jul-22
Section 'Sub' Navigation: